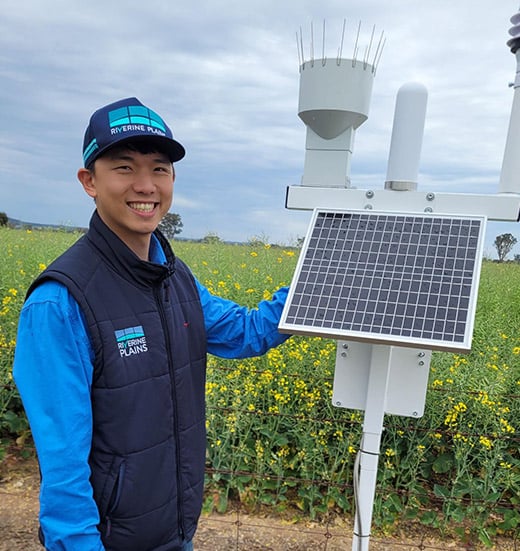
Complete our survey and go into the draw to WIN an Engel Eclipse fridge worth over $1,000!
Skip to content

Local weather & soil moisture

Providing local farmers with real-time weather and soil information to assist with decision making.

ABOUT OUR ON-FARM NETWORK OF WEATHER STATIONS AND SOIL MOISTURE PROBES

Riverine Plains manages an extensive network of on-farm weather stations and soil moisture monitoring probes across north east Victoria and southern NSW. The information provided by this network supports farmers and communities located a long way from official Bureau of Meteorology weather station sites.

Riverine Plains are currently working with Goanna Ag on a 4G infrastructure upgrade of our weather station network. We are also transitioning to a new data display platform using PairTree. During this process, weather data will not be available on our website. We are working hard to get this data operational and will inform members as soon as it is available.

With the temporary extension of the 3G network, farmers can still access the Riverine Plains network of weather stations and soil moisture probes at the following locations:

Victoria

RUTHERGLEN: Soil Moisture, Weather Station

TELFORD: Soil Moisture (Low site only)

TUNGAMAH: Soil Moisture 

CONGUPNA: Soil Moisture 

YABBA SOUTH: Soil Moisture, Weather Station 

MIEPOLL: Soil Moisture, Weather Station 


New South Wales

BAROOGA: Weather Station

BOREE CREEK: Soil Moisture

LOCKHART: Soil Moisture, Weather Station

RAND: Soil Moisture, Weather Station

RAND (WALBUNDRIE ROAD): Rainfall, Soil Moisture

DAYSDALE: Soil Moisture

CULCAIRN: Soil Moisture, Weather Station

HOWLONG: Soil Moisture, Weather Station

RENNIE: Soil Moisture


On-farm weather stations

Many farming operations are weather-dependent and on-farm weather stations can provide local rainfall, wind speed, wind direction, temperature and relative humidity information, recorded in real-time. This can be especially useful when farmers are deciding whether or not conditions are suitable for spraying or harvesting. Having access to temperature data records can also help farmers identify if a significant frost or heat event has occurred, especially if it has the potential to impact crops at sensitive stages of development. This can allow farmers to make more informed decisions about crop management.


Soil moisture probes

Soil moisture probes provide an understanding of how much water is available in the soil to support crop growth and development. They are installed at various depths across the soil profile and can indicate the depth from which plant roots can extract moisture throughout the growing season.

Having soil moisture information available at the start of the season can help farmers make decisions about their crop choice based on likely seasonal outcomes. For example, farmers may not sow high-risk crops like canola if there is a lack of moisture across the root zone and dry conditions are forecast early in the season.

Understanding the capacity of different soil types in the region to store water, and how quickly water is being extracted by crops, allows farmers to make more strategic management decisions regarding crop inputs. In dry seasons, this information can also help farmers decide whether to cut a crop for hay or take the crop through to harvest if enough soil moisture is available.

What to consider when looking at the soil moisture probe data*

The current Riverine Plains soil moisture probe network covers a variety of soil types and locations. When choosing an individual probe to use as a reference, it’s important to consider how similar the soil and crop type are to yours, as well as how close it is to your location.

How soil moisture data is collected

The soil moisture probe (capacitance sensor) is a long tube, the top of which is placed 30cm below the soil surface. This means the probe does not measure transient surface moisture and instead is more focussed on moisture at depth, where the roots are extracting water.

Moisture measurements are taken in 10cm increments down to 140cm depth, with the sensors measuring soil moisture in an 8-10cm radius from the probe.

Interpreting soil moisture graphs

Soil moisture graphs are usually presented alongside annual rainfall figures to align soil moisture with rainfall events.

Summed graph displays

A snapshot of the total moisture content of the soil down to 140cm depth is available through the summed value display. Some of these graphs also have horizontal lines that indicate the plant available water content (PAW) of the soil. The upper limit (UL) indicates that the soil water has reached its drained upper limit (also known as field capacity – FC), while the lower limit (LL) indicates the level below which plants cannot access soil water (also known as permanent wilting point – PWP). The difference between the UL and LL is considered the PAW. Summed graphs assume soil moisture is equally available to the plant at all depths, however, for water budgeting strategies, it should be assumed that less than 50% of this water is accessible to plants.

Separate Sensor Soil Moisture graph (depth increment display)

The Separate Sensor Soil Moisture graph provides greater detail around water dynamics and root growth through the profile. While this type of display appears more complex, soil moisture data is presented for each sensor, which makes it easier to tell how much moisture is being extracted by plant roots at a particular depth.

Soil type will affect how data from this display is interpreted. Three things to consider when reviewing this type of display for a given soil are:

  1. A soil or layer containing a higher sand content will have a greater moisture content, with most of the soil water able to be extracted by plants. While this moisture is readily available, it is also rapidly depleted and recharged.
  2. A soil or layer containing a higher clay content can hold more water, however only a small proportion of this water can be accessed by plant roots, due to it being strongly held by the clay particles. Soils with increased clay contents have higher total values, but a narrower PAW range. As the moisture in clay soils is strongly held by the clay particles, it is only slowly depleted, which is of high value under drying conditions, due to its slow release characteristics. This enables the soil to continue supplying water to roots for a longer period.
  3. It is useful to use calendar dates, crop stages and rainfall events to pick points of the graph which correspond to significant drying and recharge events; this will help identify the UL and LL of PAW for each depth. The difference between UL and LL can then be used to calculate the usable water in each depth (i.e. UL – LL = PAW; 31mm14mm = 17 mm PAW at the 30cm depth). Note, this is a conservative approach that does not account for any additional water stored in the 0-30cm depth. 

*This article and the installation of moisture probes at Boree Creek, Urana, Daysdale, Oaklands and Rennie were funded by the Australian Government’s Drought Communities Program, in conjunction with the Federation Council.

JOIN RIVERINE PLAINS

Riverine Plains provides opportunities to see new research and innovation, connect with rural communities, and attend informative and practical events.

The Russell Family
“Riverine Plains is the authority on farming systems and farmer-driven research that directly feeds back to our business. We've had continuous benefits from the research extension, publications, and updates.”
Andrew & Sue Russell, Lilliput Ag
Riverine Plains members